Wednesday, April 21, 2010

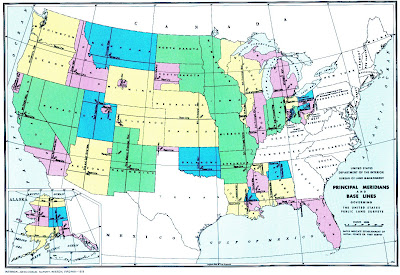
PLSS Map


A public land survey system (PLSS) map is a way of subdividing and describing land in the United States that is owned by the Federal Government for the benefit of American citizens. This is a PLSS map of the entire United States and shows the baselines and principle meridians.

http://gis.nwcg.gov/giss_2006/job_aids/maps_and_graphics/USA_PLSS_Meridians_map.jpg

Mental Map

Mental maps are mental depictions based on a person's point-of-view perception of their own world. Often, these perceptions are influenced by likes, dislikes, mass media, and pride. In this mental map, a sixth grader drew her route to and from school based entirely on memory as well as the influential factors given above. The student left out several buildings such as the power plant, which is directly across from the school because this is a hazardous location and she would prefer not to think about it, let alone draw it.

http://soa.utexas.edu/work/eaejp/Methods/Mental%20map%20from%206th%20grade-f.jpg

Star Plot

A star plot is a graphical data analysis technique for examining the relative behavior of all variables in a multivariate data set. Each spoke represents a different variable in the multivariate data set. This star plot examines the crime rates of various cities across the United States. The length of each of the spokes represents the amount of crime in any one area.

http://www.math.yorku.ca/SCS/Gallery/images/starcrim2.gif

Correlation Matrix

A correlation matrix is a rectangular assortment of numbers that gives the correlation coefficient between one variable and every other variable included in the study. When the variables are compared to themselves the correlation coefficient is always 1 and is displayed diagonally down the chart. This correlation matrix shows the correlations between principle bond and foreign exchange markets among within several countries.

http://www.investors-routemap.co.uk/images/correlation.gif

Similarity Matrix

Similarity matrices are used to express the similarity between two data points. These similarities are mapped across the graph using x and y coordinates. The higher the photo index between the points, the more similar that they are. In this matrix, multiple photos were compared to one another in order to find similarities. The scale on the right was given to show the amount of similarity recorded.

http://www.fxpal.com/systems/MediaAnalysis/sim10000.gif

Stem and Leaf Plot


Stem and leaf plots are tools for representing quantitative data in graphical form. Stem plots preserve data by using at least two significant digits: one in the left (stem) column and one in the right (leaf) column. While there is only one stem for each row, there could be an infinite number of leaves following it. This plot shows the infant mortality rates in Western Africa per 1,000 live births. The first number given combines the stem(5) with it's respective leaf(1) to create the number 51.

http://mainland.cctt.org/mathsummer/JosephBond/StemAndPlots/images/table2.gif

Box Plot


A box plot is an expedient way of graphically representing groups of data through their five-number summaries: smallest observation (sample minimum), lower quartile (Q1), median, upper quartile (Q3), and largest observation (sample maximum). This helps show spread, skewdness, as well as any potential outliers. This box plot shows minimum relative channel elevations for each channel type.

http://www.colorado.edu/research/cires/banff/pubpapers/42/Poole03.gif

Histogram

Histograms are popular graph for summarizing discrete or continuous data. This data is then divided up into classes that each receive a rectangle of height equal to the range of values in that class. For example, in this Histogram, the salary of employees in graphed from least to greatest. Histograms have a bell-shaped curve because most employees make an average income causing the middle bars to be higher than the first or last few.

http://www.statcan.gc.ca/edu/power-pouvoir/ch9/images/histo1.gif

Parallel Coordinate Graph

Parallel coordinates are popular tools for visualizing high-dimensional geometry and analyzing multivariate data. In this image, the parallel coordinate graph is shown at the bottom as the multicolored lines and serves as the control panel for selecting attributes to be explored and providing easier identification of multivariate relationships across spatial domains in the choropleth maps(top left) and the scatter plot(top right). These visualizations are of Sweden.

http://servus.itn.liu.se/projects/geowizard/images/GWFig3.png

Tuesday, April 20, 2010

Triangular Plot

Triangular plots are visual representations of three variables where their fractions or proportions add to 1 or their percentages add to 100%. This plot shows the estimated outcome of the UK's '04 political election. All three major political parties are present as well as the projected percentage of votes that each of them are expected to receive.

http://www.ex-parrot.com/~chris/tmp/talk-2004-06-15/end-of-2003.png

Wind Rose

A wind rose is a visual tool used to give a concise view of how wind speed and direction are distributed at a given location. Typically, modern wind roses are digital and are able to represent data gathered over an short or extended periods of time to show the frequency of wind direction in all directions. This is a German wind rose that displays direction as well as their appropriate degrees.

http://upload.wikimedia.org/wikipedia/commons/thumb/b/bb/Windrose.svg/600px-Windrose.svg.png

Climograph


A climograph is a graphical representation of the monthly precipitation and temperature conditions for a specified area. Precipitation is shown by the bar graph and a line graph depicts temperature. This climograph is of Buenos Aires, Argentina and shows hot, humid summers and relatively cool winters, similar to the south-eastern United States.

http://www.uwsp.edu/gEo/faculty/lemke/geog101/images/09_climograph_Cfa.gif

Population Profile

A population profile is a chart showing the number of people in the chosen population as a function of their ages. The above profile shows the population of men and women, their ages, and whether or not they are living with AIDS. This data is taken from a strategy to reduce HIV/AIDS in East and South Africa.

http://www.ifad.org/operations/regional/pf/figure1.gif

Index Value Plot

An index value plot is a visual tool in which all gathered data is compared to directly to an index point. Such plots are often used to make an informed decision on future investments and it heavily used in the stock market. This index value plot compares data over ten years to a medium between extreme wet and dry years in North Carolina.

http://waterwatch.usgs.gov/regplots/real/real_nc_2.gif

Lorenz Curve

A lorenz curve is a graph for showing the distribution of economic quantities such as wealth and income. It was created for representing inequality of the wealth distribution. This graph explains the application of the lorenz curve. The first point shows that the first 25% of the population makes 5% of national income. As the lorenz curve moves up, it represents other percentages of population and a growing amount of income that they represent.

http://content.answers.com/main/content/img/oxford/Oxford_Geography/0198606737.lorenz-curve.1.jpg

Nominal Area Choropleth Map


A nominal area choropleth map shows nominal data that cannot be calculated or measured, but instead is assigned labels such as numbers or categories. These labels aren't displayed in any specific order. This map displays nominal data in the form of ethnicity. It is a map of Africa and shows the ethnics groups of an area.

http://www.lib.utexas.edu/maps/africa/kenya_ethnic_1974.jpg

Unstandardized Choropleth Map

Unstandardized choropleth maps are thematic maps who's data has not been areally averaged, but still allows comparison between the data. This map is a prediction of the 2008 Presidential Election and shows the number of electoral votes representative of each state as well as to which candidate those votes are predicted to go to.

http://politicalmaps.org/wp-content/uploads/2007/12/2008-prediction-map-11252007.jpg

Monday, April 19, 2010

Standardized Choropleth Map

Standardized choropleth maps are those maps who's data has been areally averaged at a point to allow comparison between the data distributions. The above map is a standardized and classed choropleth map that shows the percentage of Canadians under the age of fourteen as part of the 2006 census. The higher percentages of the data seem to be located in the northern areas of Canada.

http://www.statcan.gc.ca/pub/92f0138m/2008003/figures/figure3.1-en.jpg

Bivariate Choropleth Map

A bivariate choropleth map is a thematic map that displays two variables by using two different sets of symbols or colors in order to illustrate a relationship between the two variables. This map shows the population density and percentage change in that population over a period of time in Russia. It seems that the population change in rural Russia was negative as a whole.

http://www.geog.le.ac.uk/russianheartland/DemographicMaps/images/PopulationMaps/RaionMaps/7RaionPopDenPerCh8902.jpg

Univariate Choropleth Map

Univariate choropleth maps are thematic maps that display only a single variable, such as population density or landownership. In this case, the map shows the percentage of Americans living in poverty in different rural counties across the country. The trend in this map seems to be that counties lying in the North have lower poverty rates than in the South.

http://www.dailyyonder.com/files/images/2008PovertyCountiesMapfour.jpg

Unclassed Choropleth Map

Unclassed choropleth maps are thematic maps that use shades of color that are proportional to the data. This map is of the 2004 presidential election and contrasts democrats(blue) from republicans(red). Most states are not entirely republican or democratic and so the combined colors create a purple hue. This map shows how evenly our country voted politically.

http://www.princeton.edu/~rvdb/JAVA/election2004/purple_america_2004_small.gif

Classed Choropleth Map

A classed choropleth map is a thematic map in which areas are shaded or colored to represent differing classes. In this map of the United States, there are five classes that represent the number of males to females. The lighter the shade(more tan), the fewer men there are per 100 women. The darker the shade(more green), the more men there are per 100 women. The trend in this illustration seems to be that the ratio of women to men is greater on the east coast than on the west.


http://my.ilstu.edu/~jrcarter/Geo204/Choro/

Range Graded Proportional Circle Map


A range graded proportional circle map is a proportional circle map that illustrates circles in relation to specific ranges of data. This map shows the Native American population in the United States as represented by differing sized circles. The larger the circle, the more Native Americans there are living in that area.

http://www.neiu.edu/~smkope/387/BasicPage/Proportional%20Circle%20Map.jpg

Continuously Variable Proportional Circle Map

A continuously variable proportional circle map is a proportional circle map that uses circles to relates a number that is proportional to the size of the circle. In this map, the number of Mexicans living in the United States is shown using differing sized circles. The larger the circle given, the more Mexicans living in that area.

http://www.neiu.edu/%7Ejrthomas/377/circle.jpg

Sunday, April 18, 2010

Scatter Plot

Scatter plots are visuals that help you to compare the variation in one variable relative to the variation in a second variable. They are able to overlap some maps in order to make sense of the information found on them. For example, the above scatter plot overlaps a topographic map of the United States. The data on the scatter plot is inputted using latitude and longitudinal coordinates and shows the locations of stations.

http://www.ncl.ucar.edu/Applications/Images/scatter_3_2_lg.png

DOQQ


A Digital Orthophoto Quarter-Quadrangle (DOQQ) is a digital aerial photograph that has been geometrically corrected from the original photograph which contains distortion caused by the camera's lens. DOQQs have a resolution of one meter and cover a quarter of a USGS 7.5 minutes quad or a 20x20 mile photo. This DOQQ shows the Colorado River and is taken to examine flood conditions in Texas.

http://www.crwr.utexas.edu/gis/gishydro00/Class/trmproj/Donnelly/termproject_files/1_Red_DOQQ.jpe

Thursday, April 15, 2010

DEM


A digital elevation model or DEM, is a digital representation of ground surface terrain. DEMs are often displayed using a raster graphic and are the most commonly used digital relief maps. As you can see in the image, the lighter(more red) terrain represents the higher elevations contrasted from the darker(more blue) terrain representing the lower elevation points.

http://edc.usgs.gov/images/dem.jpg

DLG

DLGs or digital line graphs are digital vector representations of cartographic information derived from USGS topographic maps. These digital graphs are able to show the linear information found on transportation, boundary, and hypsography lines. This map displays roads, rivers and standing bodies of water in Athens, Georgia.

http://ga.water.usgs.gov/olympics/athens.dlg.gif

DRG

A DRG or digital raster graphic is a digital image resulting from a scanned a paper topographic map to be used on a computer. The above image is a DRG taken of Texas. This is useful because it can be combined with other digital products such as DEMs and DOQQs to provide additional visual information on top of the base topographic map.

http://www.tceq.state.tx.us/assets/public/gis/images/drg.gif

Isopleth

In geography, isopleths are contour lines that depict a variable which cannot be measured at a point, but which instead must be calculated from data collected over an area, such as population density. As you can see in the above map of Jacksonville, an isopleth is being used to display a five year study to measure the average total toxic chemical emissions coming from three waste incinerators.

http://www.stonelions.com/Jacksonville_isopleth_map.jpg

Isopach

An isopach is a contour line joining points of equal thickness in rock layer. Isopachs are useful for estimating the volumes and dispersal of volcanic ashes. This particular isopach map shows ashfall in centimeters from a volcanic eruption in Cerro Negro, Nicaragua.

http://www.geo.mtu.edu/volcanoes/central_america/nicaragua/cerro_negro/gvn/images/2012neg4.jpg
Isohyet


Isohyets are lines drawn through geographical points linking equal amounts of precipitation during a specific period. The isohyets on this map are showing the rainfall in Colorado. This map shows where rainfall was at it's greatest causing extreme flooding and five deaths found at the two red X's.

http://www.assessment.ucar.edu/flood/img/fclflood_rain.gif

Isotach

An isotach is a line connecting points with equal wind speed on a map, often given in knots. This map has isotachs showing the different wind speeds across the United States. As you can see, the strongest winds are coming from the North-West.

http://www.underthemeso.com/blog/wp-content/uploads/entry_20070223_1.gif

Isobar


An isobar is a constant line of pressure on a map that connects areas of equal atmospheric pressure. Usually these maps contain multiple isobars denoting the different barometric pressures at different locations and altitudes. This map shows several isobars representing a low pressure system.

http://www.newmediastudio.org/DataDiscovery/Hurr_ED_Center/Hurr_Structure_Energetics/Closed_Isobars/Closed_Isobars_fig02.jpg

Wednesday, April 14, 2010

LIDAR

LIDAR is an optical remote sensing technology that makes use of scattered light in order to find information about a distant target. It is similar to radar, but differs in that radar uses radio waves and lidar often uses lasers. Therefore, lidar images are available in higher resolutions. This image is of Mount St. Helen's, Washington and shows the deformed crater.

http://vulcan.wr.usgs.gov/Volcanoes/MSH/Eruption04/Monitoring/ImagesGraphics/LIDAR_crater_dome_ sept03_and_nov04_animated.gif

Doppler Radar

Doppler Radar is a tool that makes use of the doppler effect to track objects at a distance. The most common use of this technology is in the field of meteorology and specifically the tracking of storms such as hurricanes. Doppler radar allows us to pick up a hurricane's size, speed and other conditions sometimes days before it becomes a threat.

http://www.noaanews.noaa.gov/stories/images/claudette-radar071503-1536z.jpg

Black & White Aerial Photo

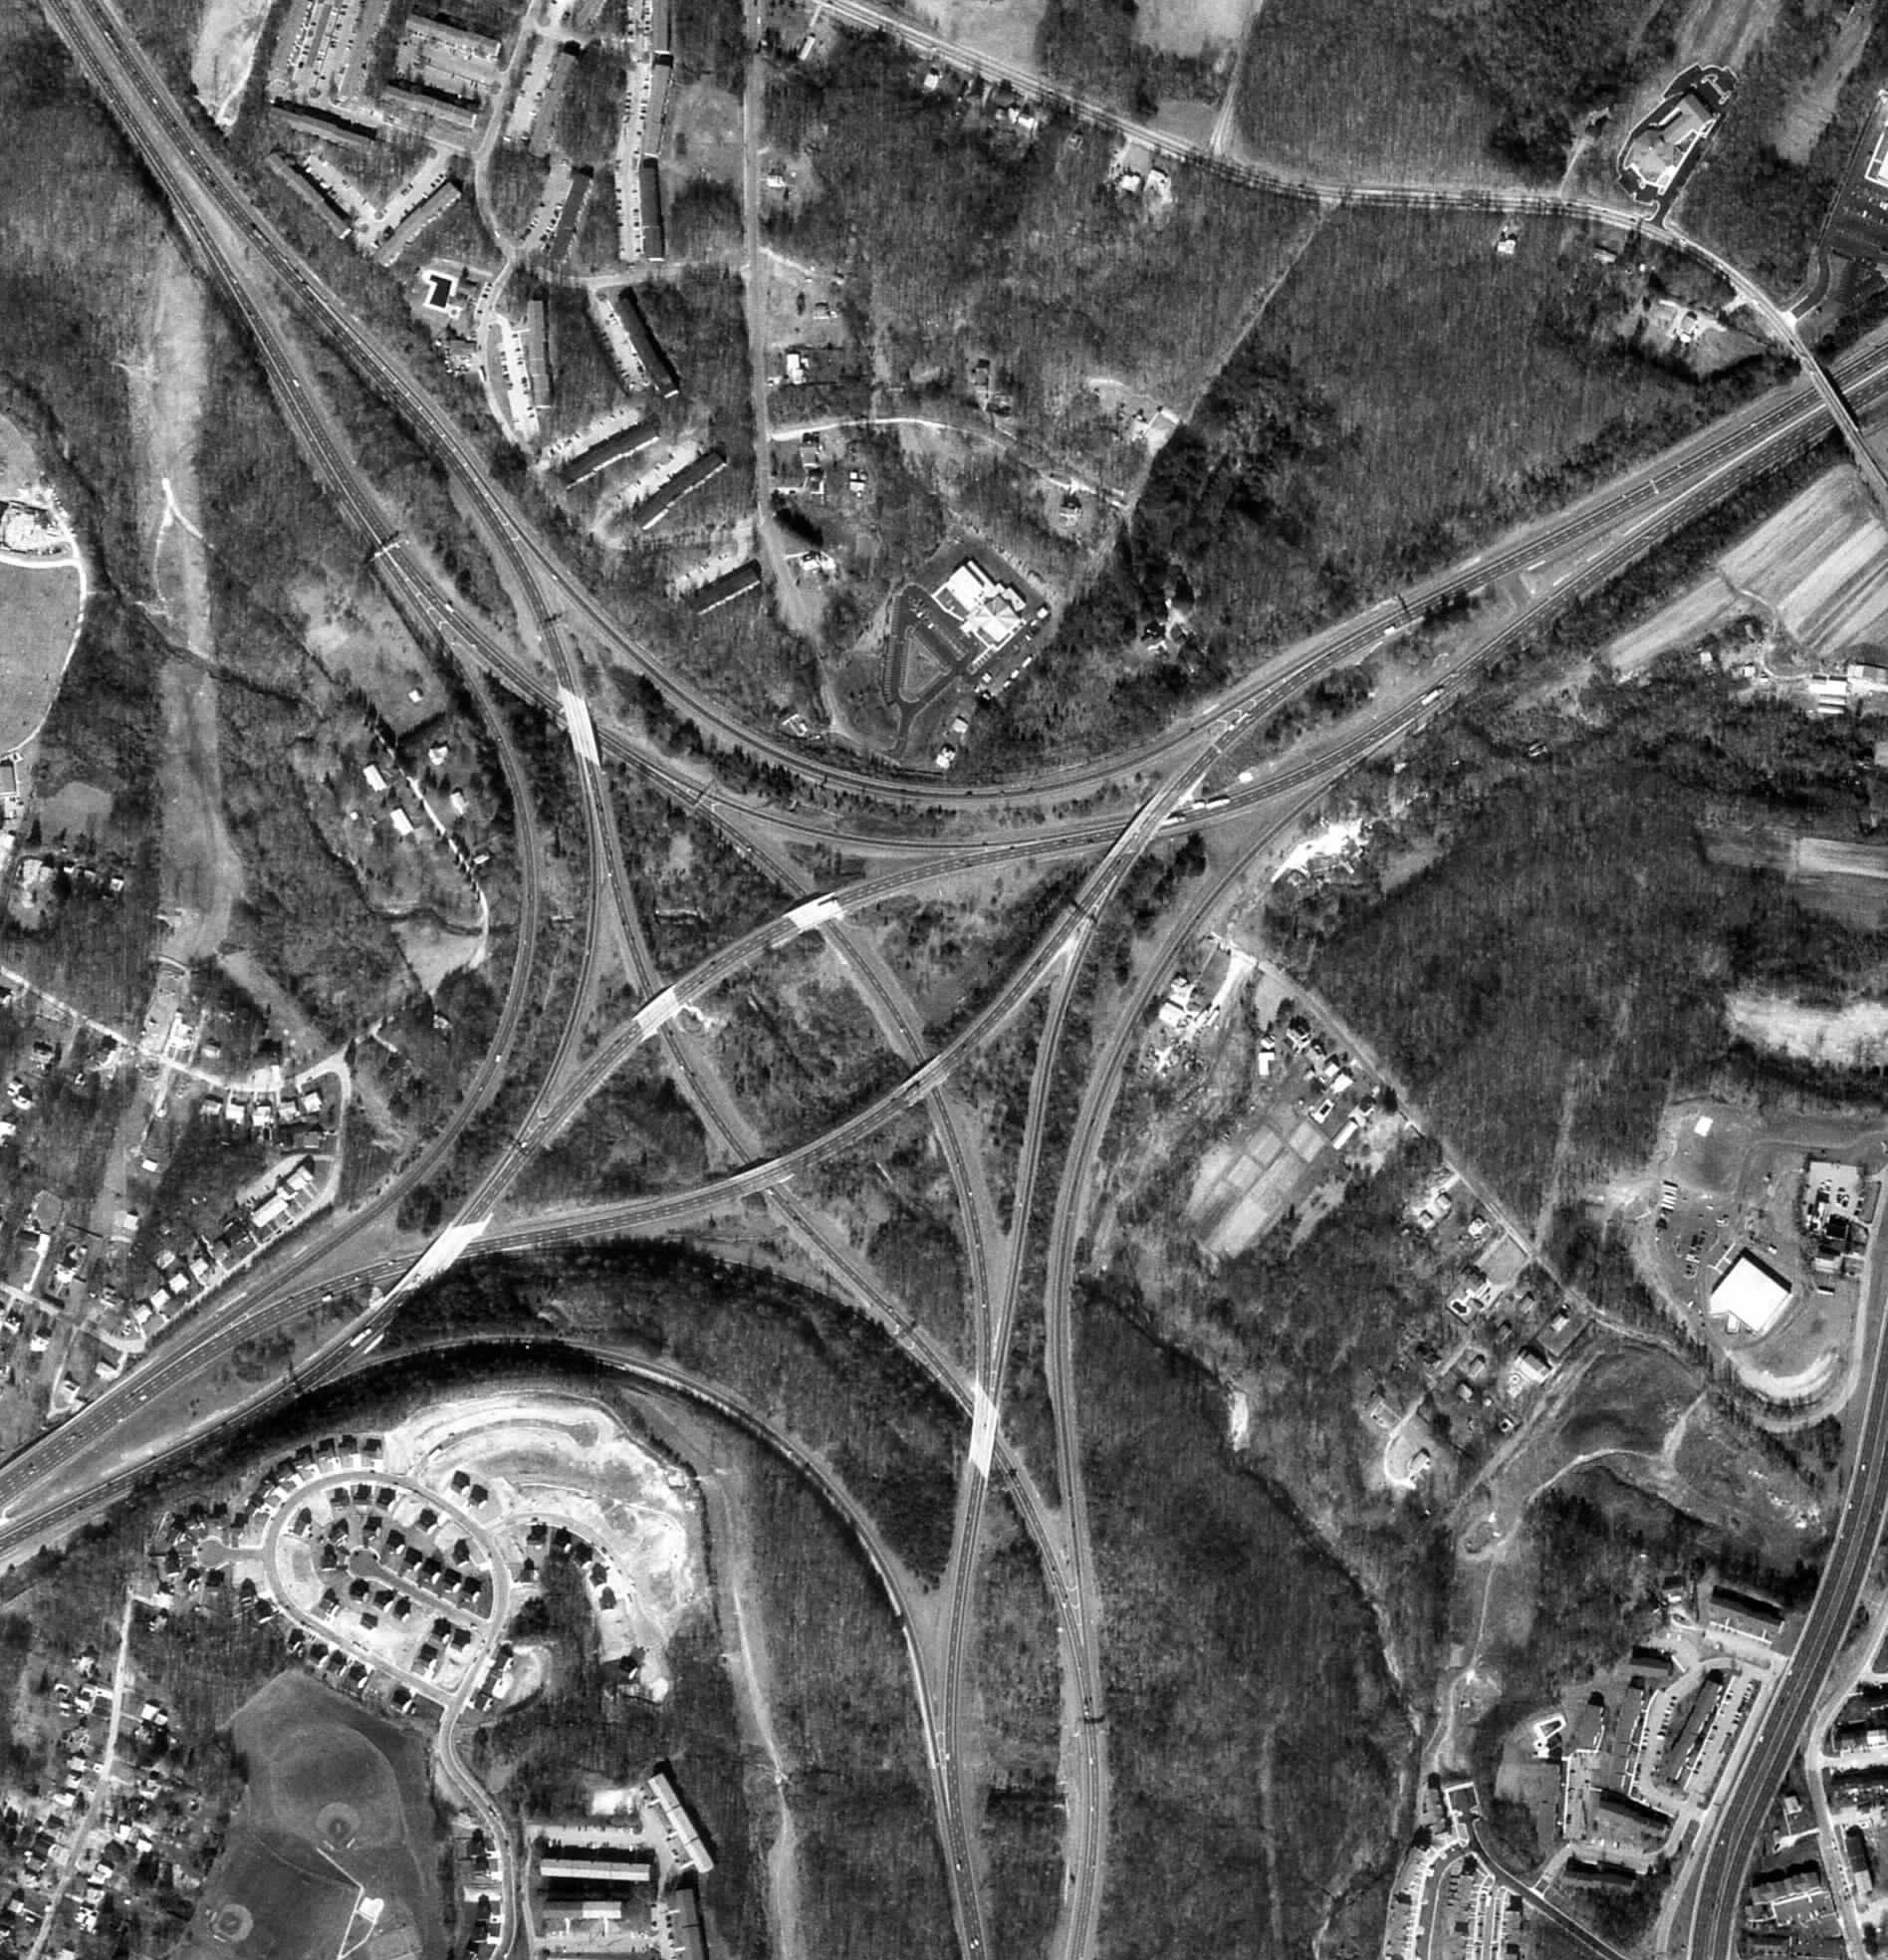
This is a black and white aerial photo taken of the I-95 and I-695 highway interchange in Boston. These aerial images were available many years before color images and so we have more of them today. Aerial images allow us to track changes in geography as well as expansion of cities over many years.

http://www.math.toronto.edu/~drorbn/Gallery/KnottedObjects/Interchange/BWPositive.jpg
Infrared Aerial Photo

Infrared aerial photos very useful to reflect the health of vegetation as well as bodies of water such as the ocean. It can track temperature to monitor dangerous conditions in areas such as chemical plants and coal mines. Anything that gives off a heat signature can be shown on these amazing images.

http://www.kgs.ku.edu/Current/2002/aber/jpegs/fig16.jpg

Statistical Map

Statistical maps are used to show the variation in quantity of specific factors such as population. This map shows the growths of the United States over a ten year period as recorded by the census. Maps such as this are useful because they can help determine the amount of government representation that each state has according to their population.

http://www.census.gov/population/cen2000/map01.gif

Cartogram

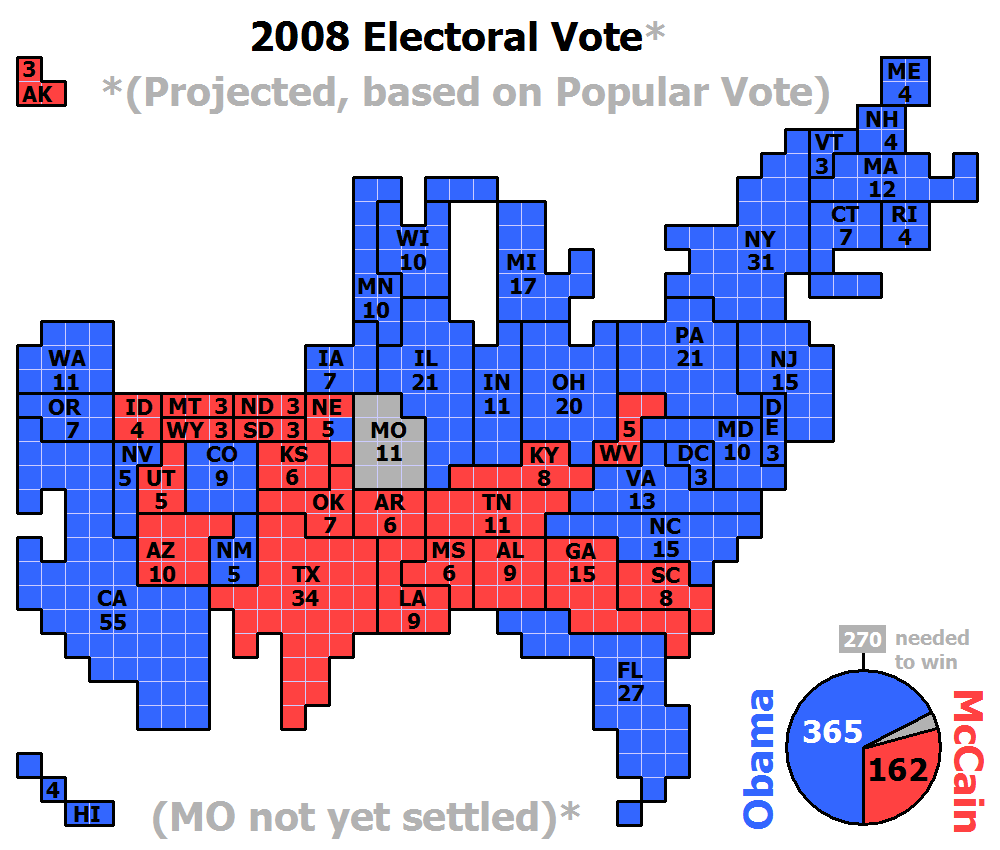
A cartogram is a map in which some thematic mapping variable, such as travel time or Gross National Product, is substituted for land area. This map is obviously simplified and not true to scale because it is meant not to show area of the states but rather a visual count of electoral votes for each presidential candidate. Often times in these types of maps the states are skewed in size to account for differing populations.

http://upload.wikimedia.org/wikipedia/commons/2/22/Cartogram-2008_Electoral_Vote.gif

Flow Map

Cartographers have long used flow maps to show the movement of objects from one location to another. They are very useful because they are able to eliminate much of the clutter found among other types of maps. This map gives a good idea of the flow of telecommunications throughout Europe and in what relative quantity people use these services.

http://www.mundi.net/maps/maps_014/august2000_small.gif


Isoline Map

An isoline map is a map with continuous lines joining point of the same value such as equal altitudes or temperatures. These maps are often used to interpret information found on thematic maps. This map shows runoff depths in China.

http://www.unu.edu/unupress/unupbooks/80157e/80157E0T.GIF

Proportional Circle Map

Proportional circle maps display data in relation to the size of the circles used. In this map, the larger circles represent areas where urban population is the highest. This map is most useful as a visual census tool.

http://mapmaker.rutgers.edu/355/dotProporCircle.jpg

Tuesday, April 13, 2010

Choropleth Map


Choropleth maps are thematic maps that are displayed using shading or patterns in proportion to the measurement of the variable being displayed on the map. This map shows the combined spending of individuals in the different areas in Great Britain.

http://www.neighbourhood.statistics.gov.uk/HTMLDocs/images/BP%2520Maps6_tcm97-50746.jpe

Dot Distribution Map

Dot distribution maps are used to help show population in areas. This map shows the population of different towns and cities in Ohio. This can be especially useful for government officials when trying to determine population trends.

http://aede.osu.edu/programs/exurbs/Maps2/tshippop1.jpg

Propaganda Map

Propaganda maps are used by the artist in order to sway people to think one way or another about a specific subject. These maps were especially popular during the first half on the twentieth century during the great World Wars. This map displays the American public's view of Russia and China during the presidency of Ronald Reagan and specifically the Cold War.

http://strangemaps.files.wordpress.com/2006/11/800px-reagan-digitised-poster.JPG?w=474&h=362


Hypsometric Map

Hypsometric maps are used to show different elevations of terrain through the use of color and shading. As you can see in this hypsometric map of France, the lower areas by the sea share a darker tint than do those areas that are inland and at higher elevations.

http://www.reliefshading.com/colors/pictures/hypso_france.jpg

Cadastral Map

This image is an example of a cadastral map. These maps are used to show visible boundaries for owned land or for separating districts. This map in particular shows the different plots of land, gives their respective numbers and includes their size in square meters.

http://balloonaerialphoto.com/images/cadastral_thumb.jpg

Topographic Map

The above image is of a topographic map. These maps are similar to planimetric maps, but differ in that they show vertical relief. This particular map is specifically of Brazil and shows the elevation of different parts of the country in meters. Many could use this map to plan their route of travel through South America to avoid mountain and rain forests.

http://www.brazadv.com/images/topographic%20map%20brazil.jpg

Planimetric Map


This planimetric map shows the political boundaries of Africa. This map type is only represented on a horizontal plain as it does not show any vertical relief. Planimetric maps such as this one are used as "road maps".

http://web.uflib.ufl.edu/maps/MAPAFRICA054L.JPG