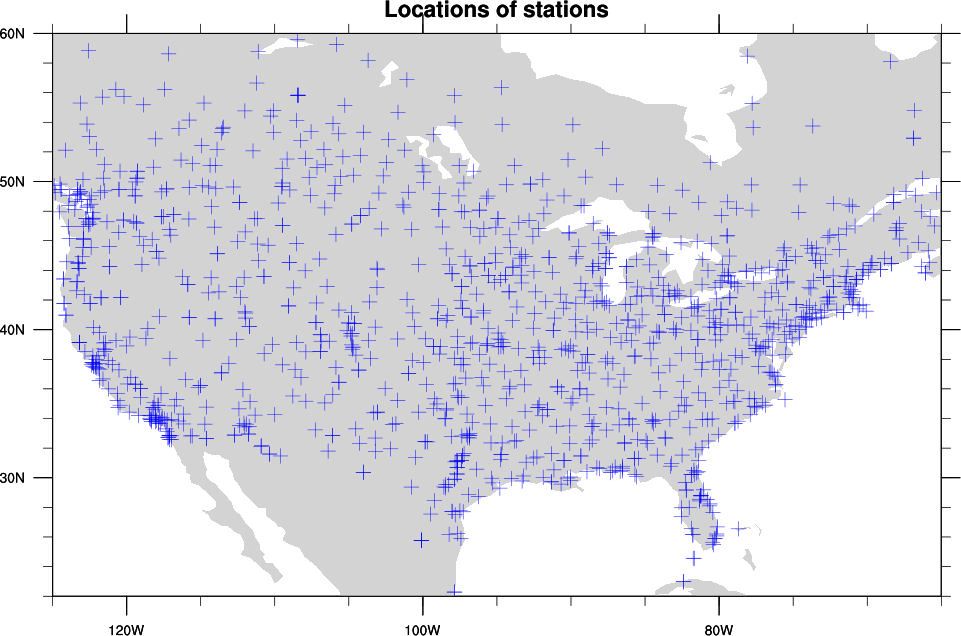
 Scatter plots are visuals that help you to compare the variation in one variable relative to the variation in a second variable. They are able to overlap some maps in order to make sense of the information found on them. For example, the above scatter plot overlaps a topographic map of the United States. The data on the scatter plot is inputted using latitude and longitudinal coordinates and shows the locations of stations.
http://www.ncl.ucar.edu/Applications/Images/scatter_3_2_lg.png
No comments:
Post a Comment