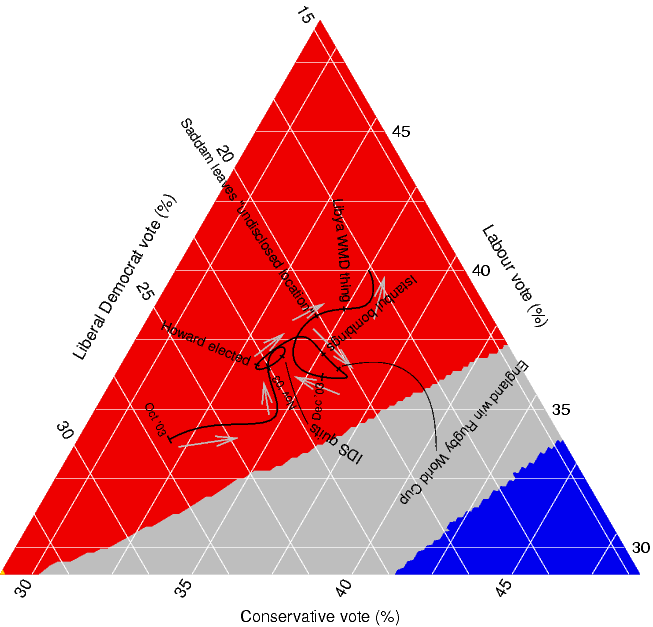
 Triangular plots are visual representations of three variables where their fractions or proportions add to 1 or their percentages add to 100%. This plot shows the estimated outcome of the UK's '04 political election. All three major political parties are present as well as the projected percentage of votes that each of them are expected to receive.
http://www.ex-parrot.com/~chris/tmp/talk-2004-06-15/end-of-2003.png
No comments:
Post a Comment